

Evolving mapping technologies have reshaped the history of cartography. From a dusty broom to artificial intelligence, these advancements revealed the world’s largest geoglyphs.
The Nazca Desert in southern Peru is the world’s most tantalizing cartographic paradox. It is a landscape that is at the same time a map itself and a terrain impossibly difficult to map. Thousands of lines, geometric shapes, and zoomorphic figures are etched into the earth. They spread across nearly 450 square kilometers of arid plateau. These are the Nazca Lines.
For centuries, these massive geoglyphs hid in plain sight. Their scale was too grand for the human eye at ground level to comprehend. The history of mapping the Nazca lines is not merely a chronicle of archaeological discovery. It is a case study in the evolution of cartographic perspective. It demonstrates how the tools we use to measure space dictate our understanding of that space.
Initially, there was confusion on the ground. Now, the latest AI-driven analyses from the cloud offer clarity. The effort to chart the Nazca Lines mirrors the technological trajectory of modern cartography.
1. Pre-modern Awareness (Before the 20th Century): The Ant’s Perspective

Before the age of flight, the Nazca Lines were essentially invisible in their true form. This period highlights a fundamental cartographic principle: scale determines perception.
The Nazca pampa is flat and vast. The lines were created by brushing away the dark, reddish-brown volcanic pebbles. This process revealed the lighter-colored subsoil beneath them. The result is a shallow trench that contrasts sharply with the surrounding ground.
Local inhabitants were certainly aware of these markings for centuries. Spanish conquistadors in the 16th century also noted “signs” in the desert. The chronicler Pedro Cieza de León mentioned this in 1547. Yet, walking on the ground, a human holds the perspective of an ant crawling across a billboard. A 300-foot-long hummingbird, viewed from the ground, appears only as a series of unrelated paths or cleared strips of land.
Early observers interpreted these features through the lens of utility. They were seen as ancient roads, trails connecting valleys, or remnants of irrigation techniques. The observer did not perceive the Gestalt, the unified whole. Hence, the area can not be “mapped” in any meaningful sense as an artistic or ceremonial landscape. The limitations define the cartographic significance of this era. Traditional ground surveying did not capture large-scale patterns. An elevated vantage point was required.
2. Aerial Discovery and the First Maps (1920s–1930s): The God’s Eye View

The cartographic revolution for Nazca arrived with the propeller engine. The 1920s saw the rise of commercial and military aviation in Peru. Faucett Airlines pilots started flying regular routes over the valleys between Lima and Arequipa. As they looked down at the pampa, they noticed something startling.
From a few thousand feet up, the “roads” suddenly coalesced into coherent shapes. The realization was immediate. These were not just functional trails. They were colossal artworks meant to be viewed from the heavens.
Peruvian archaeologist Toribio Mejía Xesspe presented the first academic report on the lines in 1927. He hypothesized they were “sacred roads.” Yet, the true cartographic breakthrough belongs to the aerial perspective. The first “maps” of Nazca Lines were not drawn; they were photographic.
In the late 1930s, American historian Paul Kosok arrived in Nazca to study ancient irrigation systems. While flying over the region, the pilot pointed out the figures. Kosok was stunned. Later, standing on the ground on June 22, 1941, the winter solstice in the Southern Hemisphere. He noticed the sun setting almost exactly at the end of one of the long straight lines. He hypothesized that the pampa was “the largest astronomy book in the world.”
Kosok’s realization sparked the need to chart these relationships. The primary cartographic tools of this era were aerial reconnaissance photos, often taken obliquely out of open cockpit windows. These early photo-mosaics were the first attempts to register the spatial relationships. They connected the spider, the monkey, and the vast trapezoids. This marked the moment archaeology fully embraced aerial survey as a fundamental tool for site discovery.
3. Mid-Century Scientific Mapping (1940s–1970s): The Era of Maria Reiche

If Paul Kosok discovered the scope of the lines, Maria Reiche mapped their soul. A German mathematician and translator initially hired by Kosok, Reiche dedicated the rest of her life to the pampa.
This period shows a fusion of aerial awareness with rigorous, old-school ground surveying. Reiche knew that aerial photos, while revealing, suffered from lens distortion and perspective limitations. To truly understand the Nazca lines, they had to be measured precisely on the ground.
Reiche’s cartographic contribution was monumental because of its physical arduousness. Living alone in the desert, she used simple, proven tools: tape measures, sextants, and compasses. She spent decades sweeping the lines clean with a broom to make them visible for measurement and aerial photography.
Reiche produced hundreds of detailed hand-drawn maps, charts, and diagrams of individual figures and geometric clusters. Her drawings of figures like “The Hummingbird” and “The Spider” stay iconic cartographic representations of Nazca. She meticulously plotted the azimuths of thousands of lines. She was trying to correlate them with celestial bodies. Her goal was to prove Kosok’s astronomical theory.
While her astronomical theories are largely disputed today, her cartographic method was sound. She introduced quantitative rigor to the study of geoglyphs. This era demonstrated that while the aerial view provides the “what,” only systematic ground-truthing provides the “how precisely.”
4. Satellite Imaging and Digital Cartography (1980s–2010s): The Digital Pampa

The late 20th century saw cartography shift from analog drawings to digital databases. The space age brought new eyes to Nazca, offering perspectives even higher than planes, and more importantly, offering multispectral imaging.
NASA’s Landsat program provided the first satellite imagery of the region. This allowed researchers to view the Nazca pampa in the context of the entire Andean drainage lineage. This was crucial for newer theories suggesting the lines were related to water rituals and aquifer locations rather than astronomy.
The real revolution, nonetheless, came with high-resolution commercial satellites like IKONOS and QuickBird in the early 2000s. Eventually, satellite imagery became democratized through Google Earth. Suddenly, anyone with an internet connection can become a Nazca researcher.
This era is defined by the rise of Geographic Information Systems (GIS). Cartographers and archaeologists no longer just drew the lines; they created layered digital maps. They overlay a layer of geoglyphs onto layers showing hydrology, topography (using Digital Elevation Models), and geological fault lines.
These digital maps allowed researchers to analyze the landscape statistically without spending decades sleeping in the desert like Reiche. They were capable of calculating the exact volume of stones moved. Researchers also analyze view sheds to find out what is visible from any given point on the pampa. Cartography became an analytical engine rather than just a descriptive tool.
5. AI-Accelerated Mapping and New Discoveries (2018-Now): The Machine’s Eye
We are now in the midst of the most rapid expansion of knowledge about Nazca in history. This is driven by two convergent technologies: low-altitude drones and Artificial Intelligence.
While satellites see the big picture, they lack the resolution to spot faint, eroded, or smaller geoglyphs. Enter the drone. Archaeologists, most notably teams from Yamagata University in Japan led by Masato Sakai, began systematically flying drones over the desert. Drones offer orthophotography with centimeter-level resolution and can generate incredibly precise 3D photogrammetric models of the terrain.
The problem quickly shifted from a lack of data to too much data. A drone survey generates terabytes of imagery—far too much for human eyes to scan effectively.
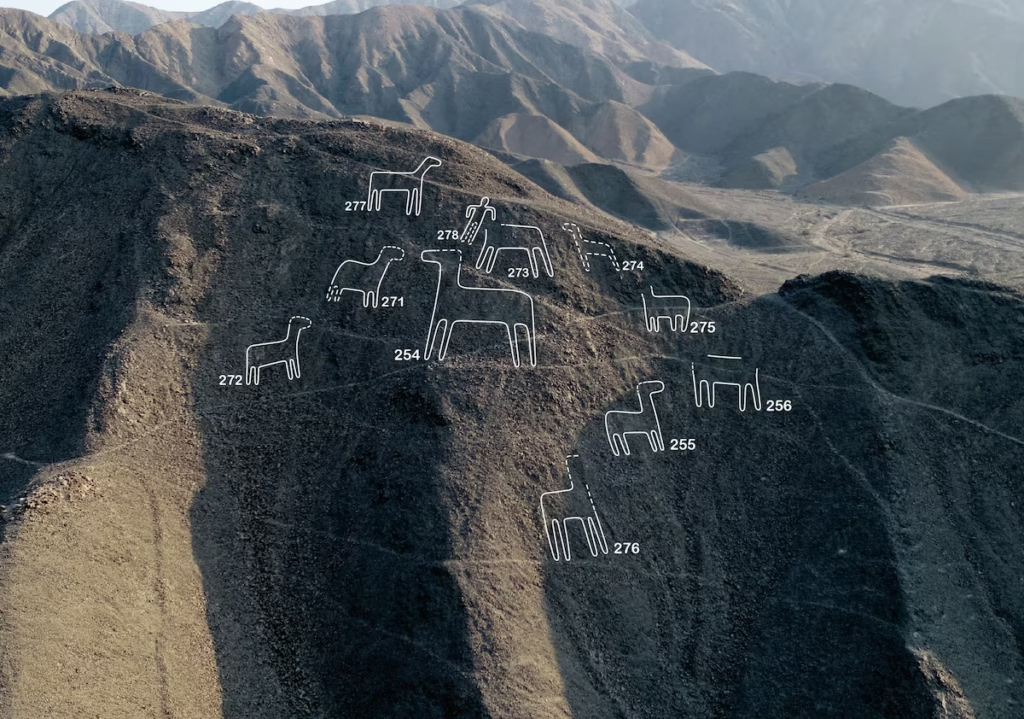
In 2019, Yamagata University partnered with IBM Research to apply deep learning AI models to this data mountain. They trained an AI on known geoglyph patterns and set it loose on the drone imagery. The AI excelled at spotting subtle variations in ground texture that humans missed.
The result was stunning. In just a few years, this approach has identified hundreds of formerly unknown geoglyphs. Crucially, these new discoveries are different. Many are smaller and older. They are located on hillsides rather than the flat pampa. This changes our historical understanding of the culture that built them.
The cartographic significance here is profound. The “mapmaker” is no longer solely human. We are now relying on non-human intelligence to perceive patterns in the landscape that we can’t see ourselves. The maps generated by these AI systems are probability heat maps. These maps guide human archaeologists to where they should look on the ground.
Conclusion: The Map Creates the Territory
The history of mapping the Nazca Lines shows that a map is more than a reflection of reality. It is a tool that constructs reality.
Before the 1920s, the Nazca Lines did not exist as a coherent concept. There was no cartographic method to visualize them. The airplane created the canvas. Maria Reiche’s tape measure provided the dimensions. Satellites provided the environmental context. And today, AI is filling in the blanks we didn’t know existed.
For cartography, Nazca is the ultimate proving ground. It is a landscape that demands we constantly invent new ways to see. This proves that even after centuries of looking at the world, there are still wonders hiding in plain sight. These wonders are waiting for the right map to reveal them.